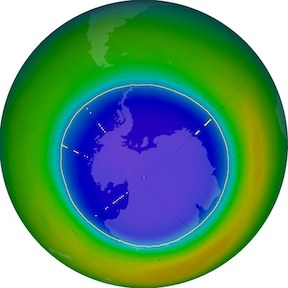
 Figure 1: An example figure showing the Antarctic ozone hole. High ozone concentrations are shown in orange/red and low ozone concentrations are shown in purple.
Introduction Methods Results and Discussion Conclusion References Supplemental Info
FINAL REPORT TEMPLATE: Download Word Doc
data folder for the data. You will then see folders for several locations. You will need data from grsm-purchase/2019 (Purchase Knob) and mack/2019 (Dillsboro, NC). You will also need the NOAA weather station data in grsm-purchase/2019/weather_noaa directory. Make sure you use the 10 minute average (10minAvg) versions of the data!The introduction to the paper serves to orient the reader to the topic at hand and provide an very brief overview of the study at hand. If you’ve written a research paper or 5-paragraph essay for a class before, the introduction is much the same. You can think of it as a 5-paragraph essay that makes up the first section of your paper (but don’t necessarily limit yourself to the 5-paragraph format). Of course, this means you will have to do research to write the intro! It should convey what questions the study is asking, why it’s asking those question, and what led the author’s to ask those questions. It should also discuss any similar work that’s been done previously and describe how the author’s work relates to the previous studies. Provide context by citing relevant scholarly sources. There is no specific formula for what to include – the intro is your chance to decide what you think is important for the reader to know.
The Introduction section should answer two questions: “What?” and “So what?” What is the paper about, and why should the reader care? [1]
Style tips:
The methods section provides the reader of your manuscript a detailed account of how you completed your study. It should contain enough information that the reader could complete your study with no other resources. However, it should not contain extraneous details or irrelevant minutia. More information about what constitutes appropriate detail is provided in Mack (2018). [1]
There are really two interrelated goals at work: the reader should be given the ability to reproduce the results and the ability to judge the results. [1]
For this assignment, you should turn in a methods section to your final paper that details your sensor construction and deployment.
Style tips:
Examples:
Table 1: A table with a lot of useful information
| Column 1 | Column 2 |
|---|---|
| a bit of info | some more info |
Figure 1: An example figure showing the Antarctic ozone hole. High ozone concentrations are shown in orange/red and low ozone concentrations are shown in purple.
Your document should have the following sections:
II. Materials and Methods
A. Hardware Components
Each of these figures should be explicitly referred to in the text, in order. This means you will also have to supply text discussing each figure in detail.
This section should also provide a description of what was done to weatherproof the sensors and a description of how the sensor was assembled (you will be given a bill of materials to use as an appendix)
Refer to Table 1 below for a review of the sensors used and measurements conducted.
B. Site Description
Example site description:
Site B: One sensor was deployed near Dillsboro, North Carolina, United States at an elevation of 770 m (17S 293055 3914390). Dillsboro is a small town near the Great Smoky Mountains of North Carolina and can be classified as a rural site. The sampling site is in a small grassy clearing between forest and a gravel road. Moreover, the site is in a cove with a rock quarry and asphalt plant, along with many residential wood fireplaces. The sensor was mounted 1 m from the ground on a metal pole. This site was chosen as a rural site with heavy anthropogenic influence.
C. Sampling Routine, Data Processing, and Data Storage
Table 1: Sensors Used
| Measurement | Sensor |
|---|---|
| Particulate Matter (PM$_{2.5}$) | Honeywell HPMA115S0-XXX |
| Volatile Organic Carbon (VOC) | Bosch BME-680 |
| Temperature | Bosch BME-680 |
| Relative Humidity | Bosch BME-680 |
| Pressure | Bosch BME-680 |
The Results and Discussion section serves two purposes: (1) to present the results (data) and (2) to put those results into context with a thoughtful discussion about whether the results were anticipated, how they compare to previous work, and how they can be explained using models, theories, general knowledge, and reasoning. Note that the results section should be a logical argument based on evidence, not a chronological description of the experiment.
Evidence does not explain itself. The purpose of the Discussion section is to explain the results and show how they help to answer the research questions posed in the introduction. This discussion generally passes through the stages of summarizing the results, discussing whether results are expected or unexpected, comparing these results to previous work, interpreting and explaining the results (often by comparison to a theory or model), and hypothesizing about their generality. [1]
You must present results supporting every conclusion you draw; likewise, you must use sound logic when interpreting the results to draw conclusions. Similarly you must not withhold results that don’t support your hypothesis or conclusions; all results must be reconciled, whether they agree or not.
Style tips (see the writing guide for more info): - Write in paste tense. - Be specific. - Avoid faulty and incomplete comparisons.
Please see [1] for more information and [2] (section 3 “Results and Discussion”) as an example of a results and discussion section. Ref [3], section V “Experimental Analysis” also provides an example of a results and discussion section.
Note that there is a distinct difference between correcting errors (e.g. an incorrectly set clock) and “correcting” (making up) data; the first is necessary, the second is unethical.
Include, at minimum, the following:
Remember to label your axes (and include units) and provide a caption below each figure with a number for each figure. Provide a summary of each figure in the main text, and refer to each figure by number where it’s discussed; figures should appear/be numbered in the order in which they are discussed. When discussing each figure, provide not only a summary of the figure but also your interpretation of the data. Put the data in context. How do the data relate to other data or typical trends? Do your data agree with the NOAA (“gold-standard”) sensors? Do the data from Purchase Knob and Dillsboro agree? Are the results expected and easily explained by common knowledge/theories, or are they unexpected? You do not have to specifically answer all these questions, but they should provide a starting point to help you think about discussing the data (it is the Results and Discussion section, after all!).
The conclusion should provide a brief summary of the results, highlighting the key breakthroughs or findings. It should specifically relate the conclusions back to the research questions posed in the introduction and explain their significance. Finally, it should provide recommendations for future improvements or expansions upon the study. It should not just repeat other portions of the paper.
The Conclusions section should allow for opportunistic reading. When writing this section, imagine a reader who reads the introduction, skims through the figures, then jumps to the conclusion. The conclusion should concisely provide the key message(s) the author wishes to convey. [1]
Your references should be cited in IEEE format. You should only cite scholarly sources. Points may be deducted for sources that do not meet the guidelines outlined in the Scholarly Sources workshop in the library. Please refer to this flowchart to determine if your source counts as scholarly. If in doubt, it’s probably not scholarly.
You should include the following table as supplemental information. You can reference this table in your methods section as the bill of materials for the sensor.
Table S.1: Bill of Materials for Sensor
| Item | PN | Price | Qty | Supplier |
|---|---|---|---|---|
| Sensor, BME 680 | 1597-1653-ND | $20.910 | 1 | digikey |
| Sensor, PM, Honeywell | 785-HPMA115SO-XXX | $26.340 | 1 | mouser |
| Micro SD | SDSDQM-B35A | $4.500 | 1 | Amazon |
| Teensy 3.5 | 1568-1443-ND | $26.250 | 1 | digikey |
| USB Cable | WM25438-ND | $3.710 | 1 | digikey |
| Case | Lowes | $7.150 | 1 | Lowes |
| Case Port | Lowes | $1.690 | 0.5 | Lowes |
| Breadboard | 1738-1326-ND | $2.990 | 1 | digikey |
| Wire, Hookup, Assortment, 10x25’ | 485-3174 | $29.950 | 0.1 | mouser |
| Pin headers, Breakaway, 36 position, 0.1” | WM50014-36-ND | $0.901 | 2 | digikey |
| LED, RGB | 1830-1014-ND | $0.829 | 1 | digikey |
| Resistor, 220 ohm | CF12JT220RCT-ND | $0.072 | 1 | digikey |
| Thermistor | BC2301-ND | $0.660 | 1 | digikey |
| Resistor, 1k | S1KQTR-ND | $0.004 | 1 | digikey |
| Capacitor, Electrolytic, 1000uF | P19639TB-ND | $0.310 | 1 | digikey |
| Relay | TLP222AF-ND | $1.013 | 1 | digikey |
| Header, 5 Position, 0.1 | S6103-ND | $0.443 | 1 | digikey |
| Header, 24 Position, 0.1 | S7022-ND | $1.244 | 2 | digikey |
| Retainer, Coin Cell, 12 MM, SMD | 36-3000CT-ND | $0.767 | 1 | digikey |
| Terminal, 4 Position, 3.5 mm | WM7860-ND | $1.121 | 2 | digikey |
| Terminal, 2 Position, 3.5 mm | WM7877-ND | $0.718 | 1 | digikey |
| Batteries, AA, Duracell Procell, 2900 mAh | PC1500BKD | $0.520 | 6 | Grainger |
| Batteries, Coin Cell, CR1220 | P033-ND | $0.828 | 1 | digikey |
| Wire, PicoBlade, Pre-crimped, black | 0500798000-10-B8-ND | $0.676 | 1 | digikey |
| Wire, PicoBlade, Pre-crimped, yellow | 0500798000-10-Y8-ND | $0.676 | 1 | digikey |
| Wire, PicoBlade, Pre-crimped, red | 0500798000-10-R8-ND | $0.676 | 1 | digikey |
| Wire, PicoBlade, Pre-crimped, violet | 0500798000-10-V8-ND | $0.676 | 1 | digikey |
| PCB, Custom | WheeCAir v1.0 (custom) | $6.820 | 1 | OSH Park |
[1] Mack, Chris A., How to Write a Scientific Paper. SPIE, 2018. doi: 10.1117/3.2317707
[2] Ardon-Dryer, Karin, Y Dryer, J.N. Williams, and N. Moghimi, “Measurements of PM$_{2.5}$ with PurpleAir under atmospheric conditions,” Atmospheric Measurement Techniques (Discussions) (in review) doi:10.5194/amt-2019-396.
[3] Guisto, Edoardo, R Ferrero, F. Gandino, B. Montrucchio, M. Rebaudengo, and M. Zhang, “Particulate matter monitoring in mixed indoor/outdoor industrial applications: a case study,” Proceedings: 2018 IEEE 23rd International Conference on Emerging Technologies and Factory Automation, Sept. 4-7 2018, Turin, Italy. doi: 10.1109/ETFA.2018.8502644.